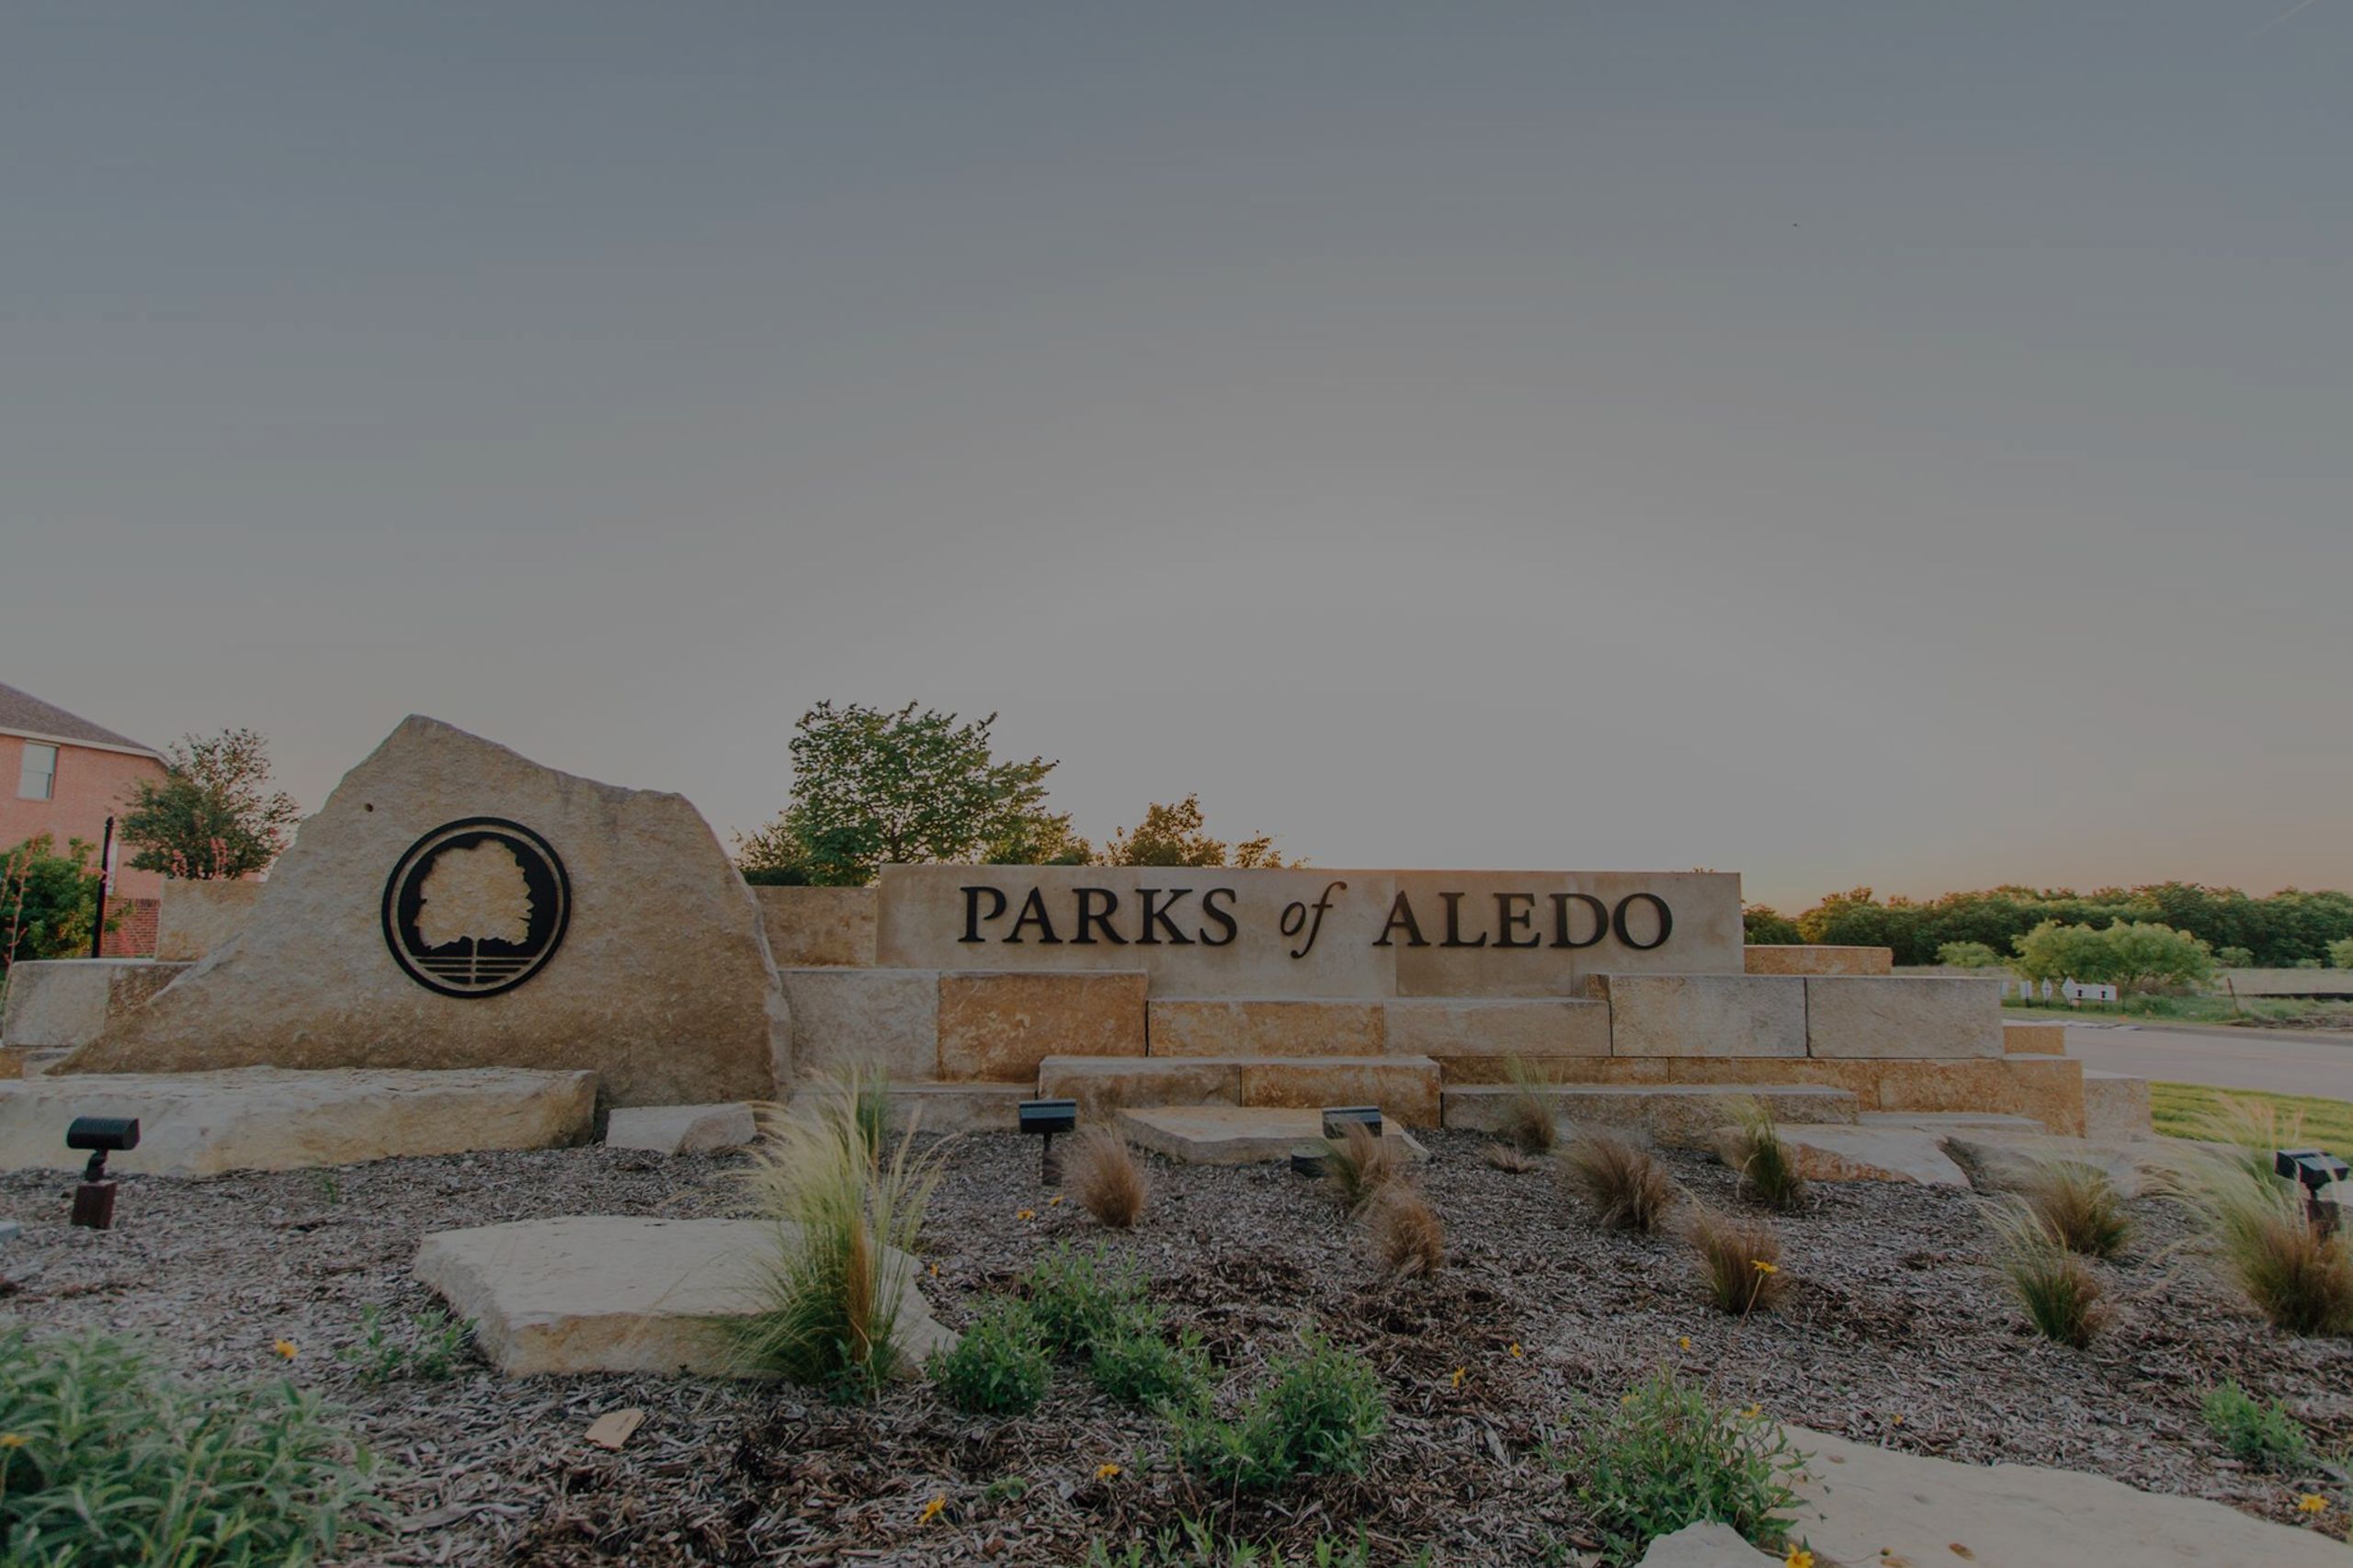
We occasionally update some sales and active market data for the Parks of Aledo. More information about the Parks of Aledo can be found on their Facebook page, and webpage.
I did this same post in April of 2019. Check it out and see how things are trending in Parks of Aledo
| Active Listings: | |
| Number of Homes | 11 |
| Average Price | $456,655 |
| Average Square Feet | 2,904 |
| Average Price Per Foot | $158.76 |
| Average Days on Market | 74 |
| Under Contract: | |
| Number of Homes | 8 |
| Sold in Last 90 Days: | |
| Number of Homes | 16 |
| Average Price | $458,890 |
| Average Square Feet | 3,009 |
| Average Price Per Foot | $153.05 |
| Average Days on Market | 80 |
| Sold in Last 180 days: | |
| Number of Homes | 26 |
| Average Price | $462,257 |
| Average Square Feet | 3,094 |
| Average Price Per Foot | $150.18 |
| Average Days on Market | 91 |
| Absorption Rate: | 2.5 months |
| What is it? | Amount of time needed to sell the existing inventory. |
| 1-4 months of inventory | Seller’s Market |
| 5-6 months of inventory | Neutral Market |
| 7+ months of inventory | Buyer’s Market |
This is the height of the selling season in the Aledo market. We are seeing lower inventory than usual. I believe that is partially due to COVID-19 but also the fact that there is a lot of new construction pre-sales, and these numbers never hit the MLS.
Call us if you are curious about the neighborhood or would like to see some homes.