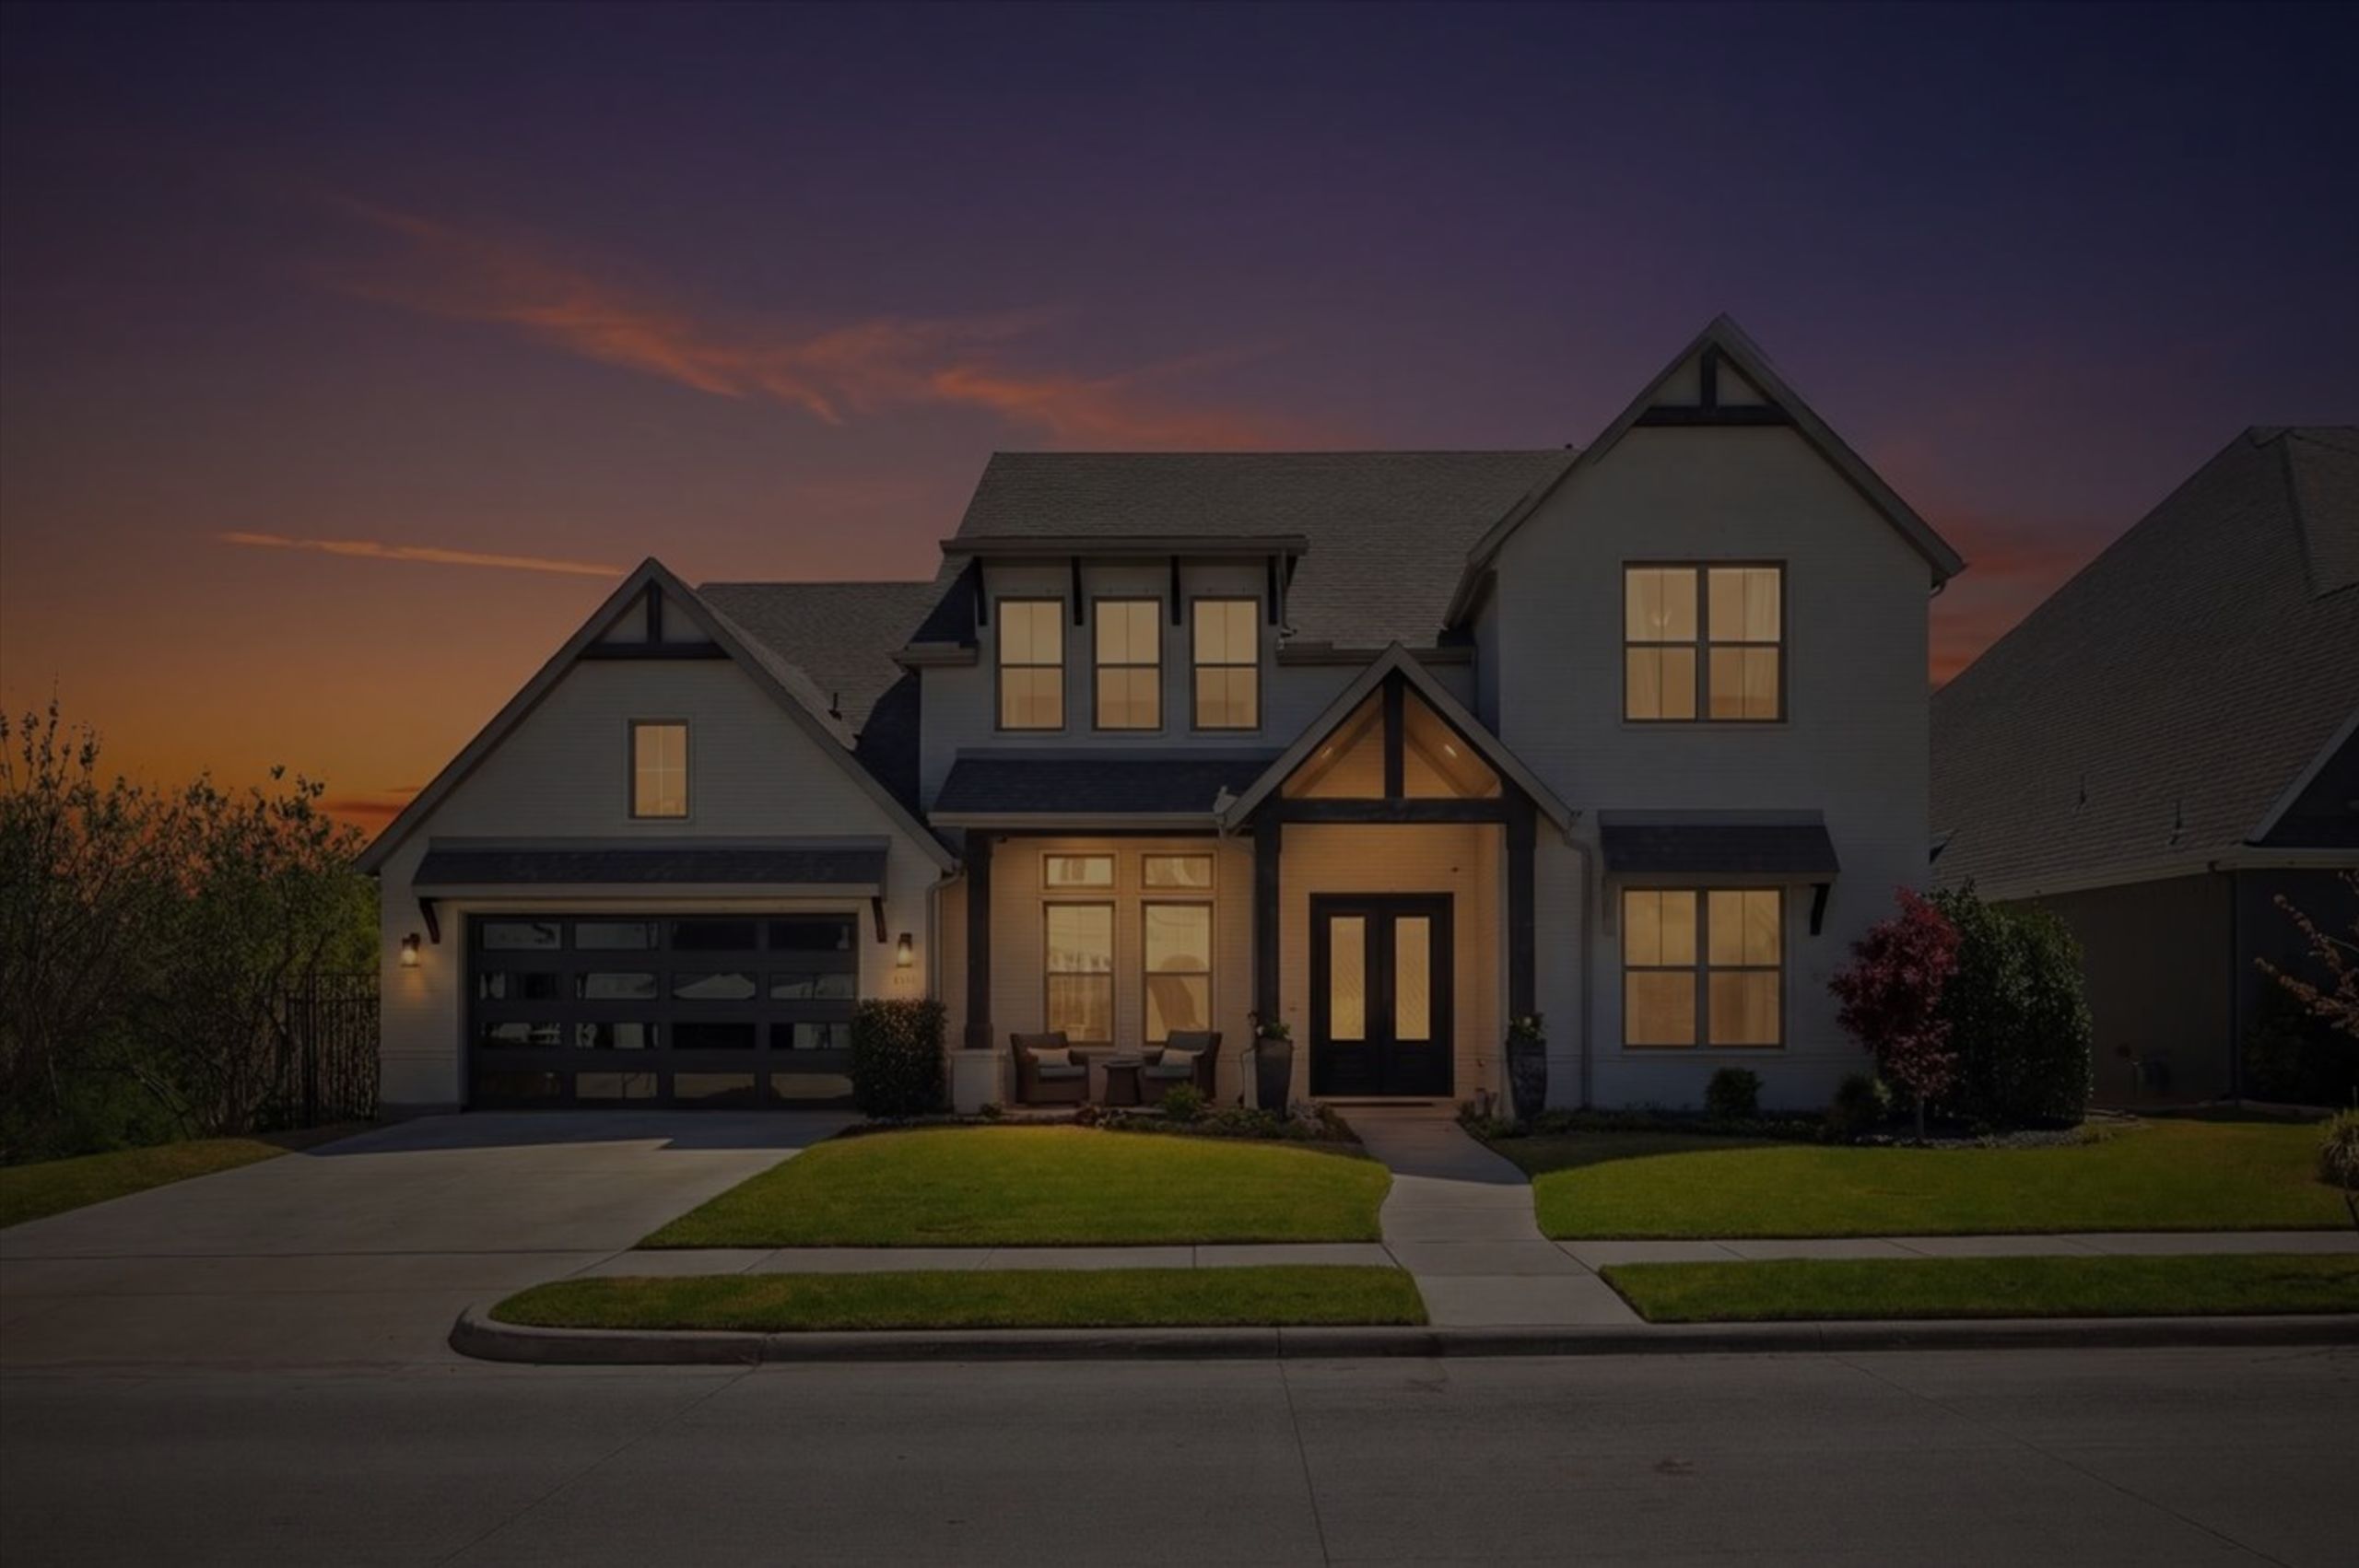
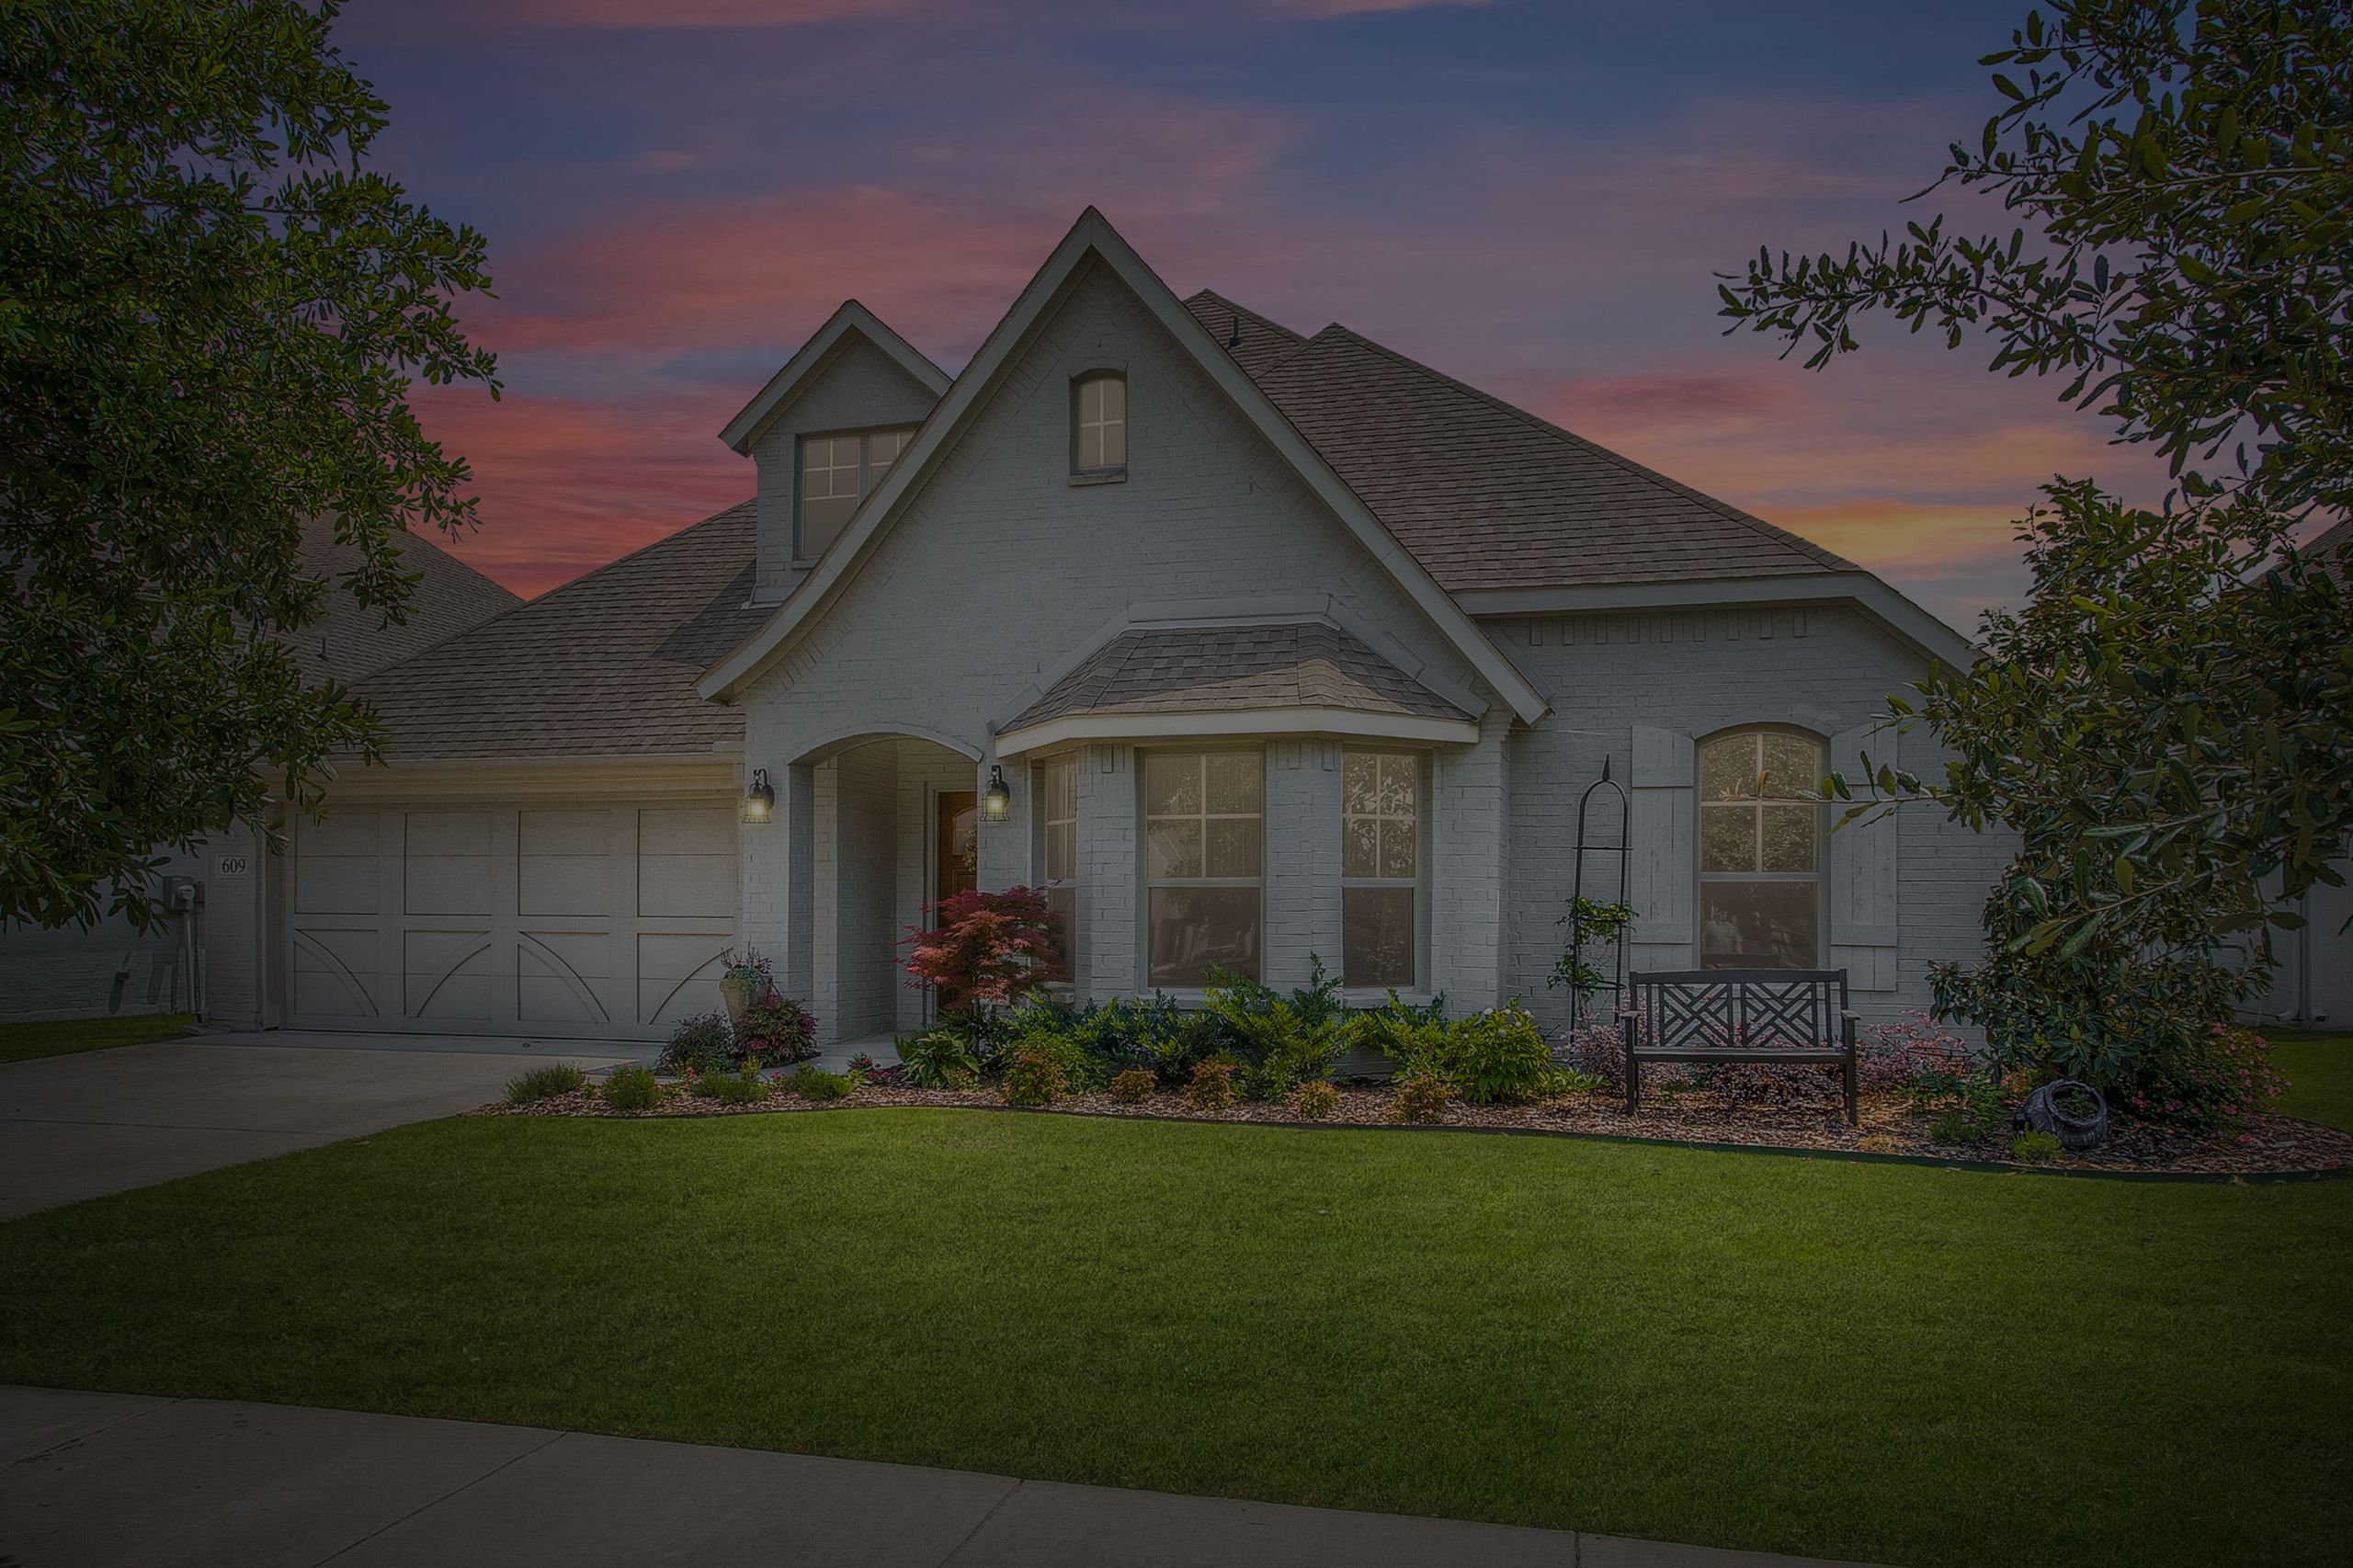
We last updated this post in March, just a few months ago, for market stats in Parks of Aledo. More information about the Parks of Aledo can be found on their Facebook page, and webpage.
Here is a link to the March post. Check it out and see how things are trending in Parks of Aledo
| Active Listings: | |
| Number of Homes | 7 |
| Average Price | $651,429 |
| Average Square Feet | 2,734 |
| Average Price Per Foot | $244.69 |
| Average Days on Market | 43 |
| Under Contract: | |
| Number of Homes | 11 |
| Sold in Last 90 Days: | |
| Number of Homes | 12 |
| Average Price | $680,059 |
| Average Square Feet | 3,377 |
| Average Price Per Foot | $202.85 |
| Average Days on Market | 31 |
| Sold in Last 180 days: | |
| Number of Homes | 19 |
| Average Price | $634,774 |
| Average Square Feet | 3,234 |
| Average Price Per Foot | $197.26 |
| Average Days on Market | 26 |
| Absorption Rate: | 2 1/2 months |
| What is it? | Amount of time needed to sell the existing inventory. |
| 1-4 months of inventory | Seller’s Market |
| 5-6 months of inventory | Neutral Market |
| 7+ months of inventory | Buyer’s Market |
The absorption rate is very good and has stayed consistent during this selling season. The last 90 days have been very active, doubling the activity of homes sold from the last post. 11 homes are currently pending sale, so in a matter of a month of less, we will see a large increase in recent sales.
Remember, these reports are just reflecting the homes sold through the MLS. There are also build-job sales, and off-market sales. This just means that things are very, very active, and as you can see from data from March to June, this is the prime selling season.
Call us if you are curious about the neighborhood or would like to see some homes.